Datadog is a monitoring and analytics platform that helps businesses keep track of their online stuff and figure out how to make it work better.
Important Terms :-
i)HOST :- A host is any physical or virtual OS instance that we can monitor using Datadog.
ii)DATADOG AGENT :- A Datadog agent is a software that collects data from hosts and sends it to Datadog for analysis.
iii)DATADOG TAGS:- Datadog tags are labels or identifiers added to hosts or other resources to help organize and group them for monitoring and analysis. Example :- version:stage , version:prod .
#How to install datadog agent in Ubuntu Linux?
1)Create an account by visiting https://www.datadoghq.com/
2)Create an AWS EC2 instance (UBUNTU 22.04 LTS).
3)Run the below command in the instance . (Don't forget to insert the keyword "sudo" before the below command).
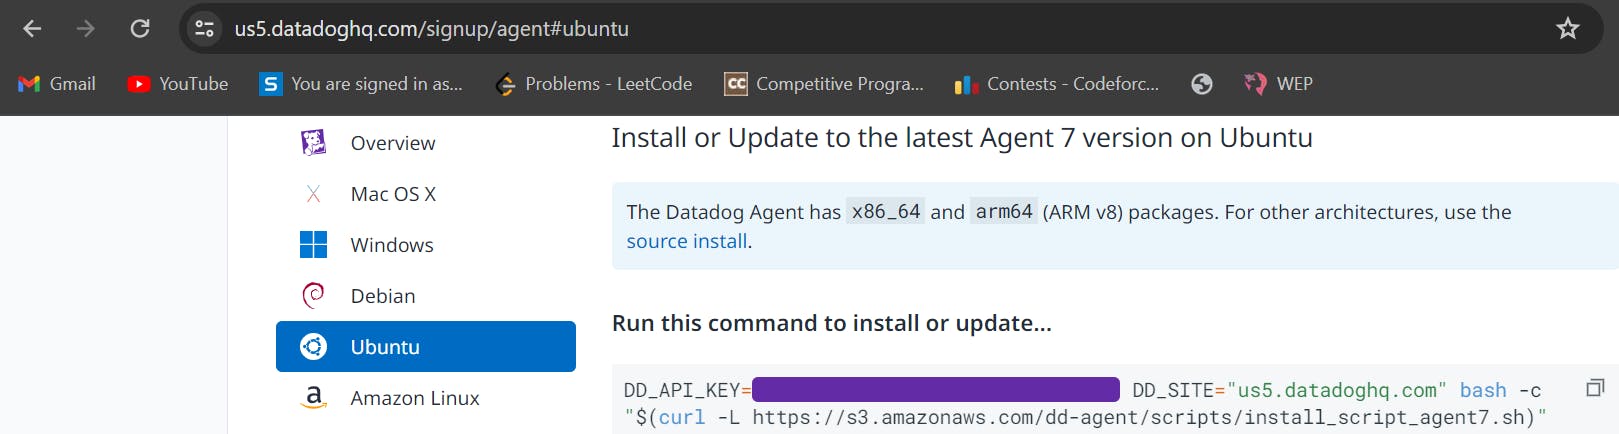
Use the command
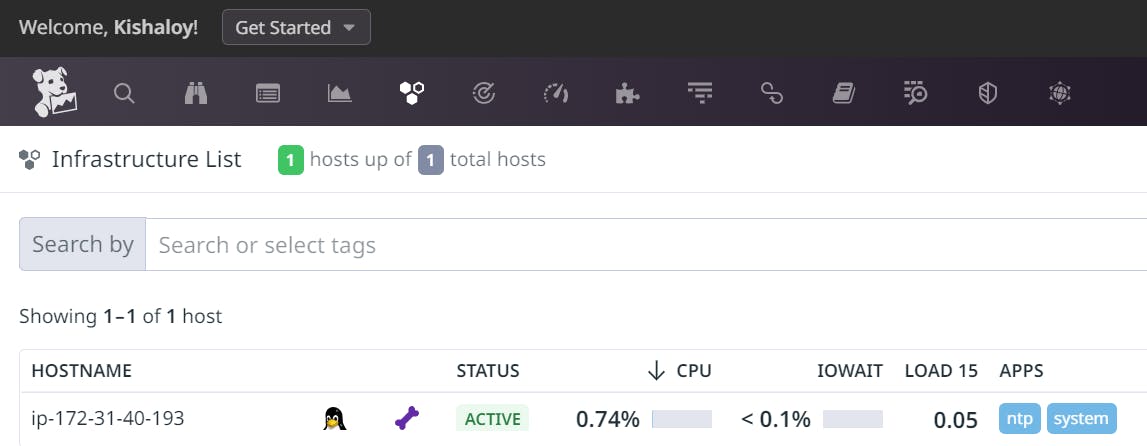
sudo service datadog-agent startto start the agent as a service.We can see our host in the Infrastructure list :-
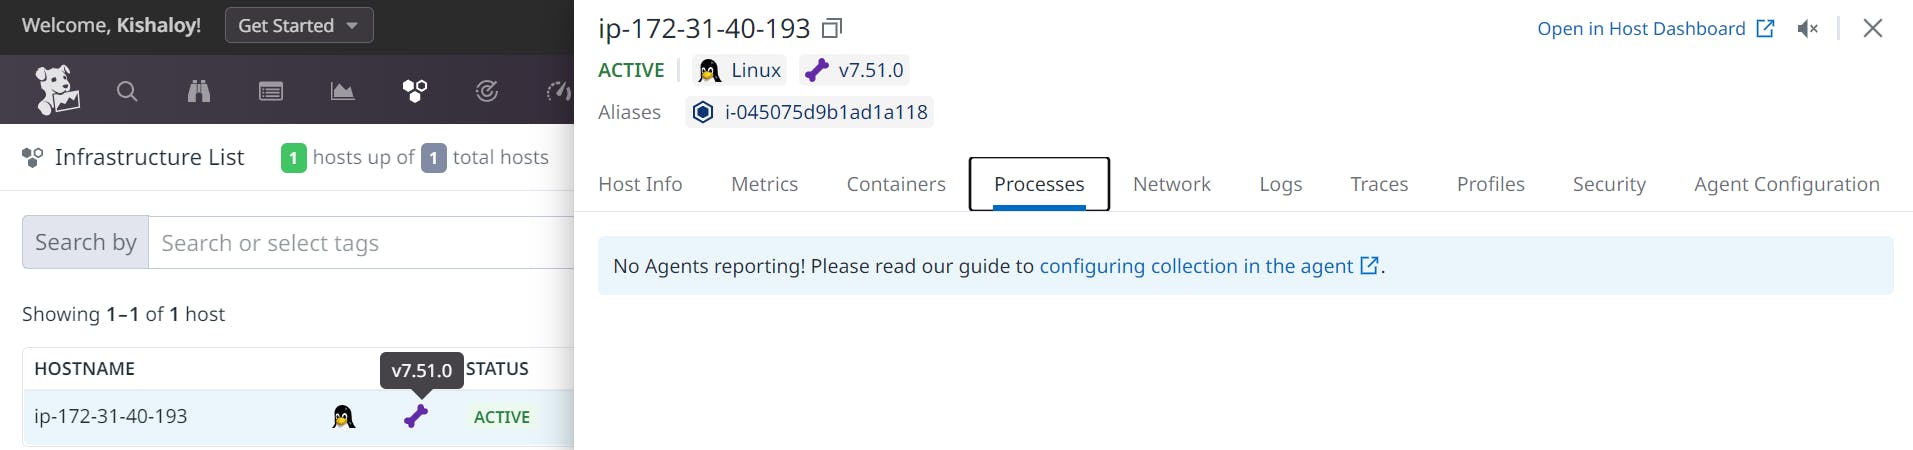
#Live Process monitoring in Datadog Agent:-
- Initially , we see that there are no processes.
- In the Ubuntu server , we have to run the following commands:-
cd /etc/datadog-agent
sudo vim datadog.yaml
Then we have to do the following changes in the datadog.yaml file

Then we need to restart the datadog agent using the command
sudo service datadog-agent restart
- Now we can see the processes :-

#Enabling Network Performance Monitoring
- Initially we see that Network Performance Monitoring isn't enabled :-
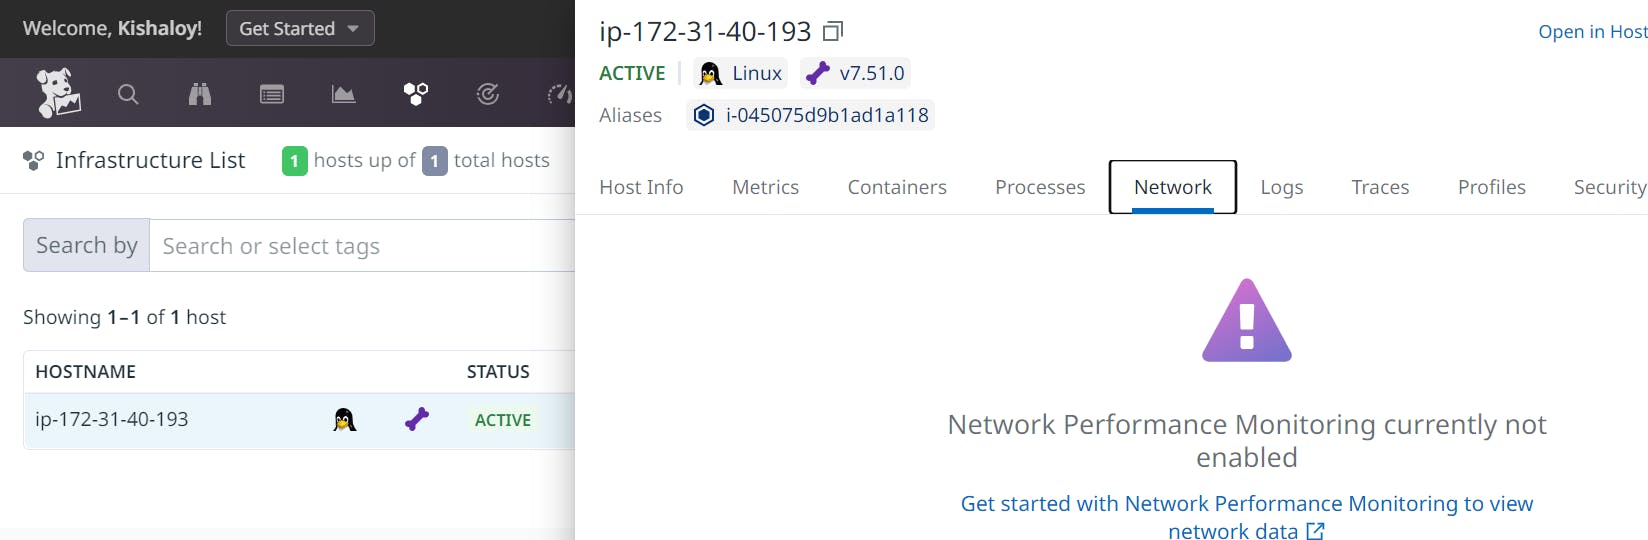
- In order to enable the NPM , we just need to follow the documentation at :- https://docs.datadoghq.com/network_monitoring/performance/setup/?tab=agentlinux
#Datadog real user monitoring (RUM):-
Datadog Real User Monitoring (RUM) allows us to monitor the performance of our website from the perspective of our users. It provides insights into how our website performs across different browsers, devices, and locations.
Suppose I want to monitor my website present at https://kkchowdhury.github.io/KKC-Builders/ , then the steps I need to follow are :-
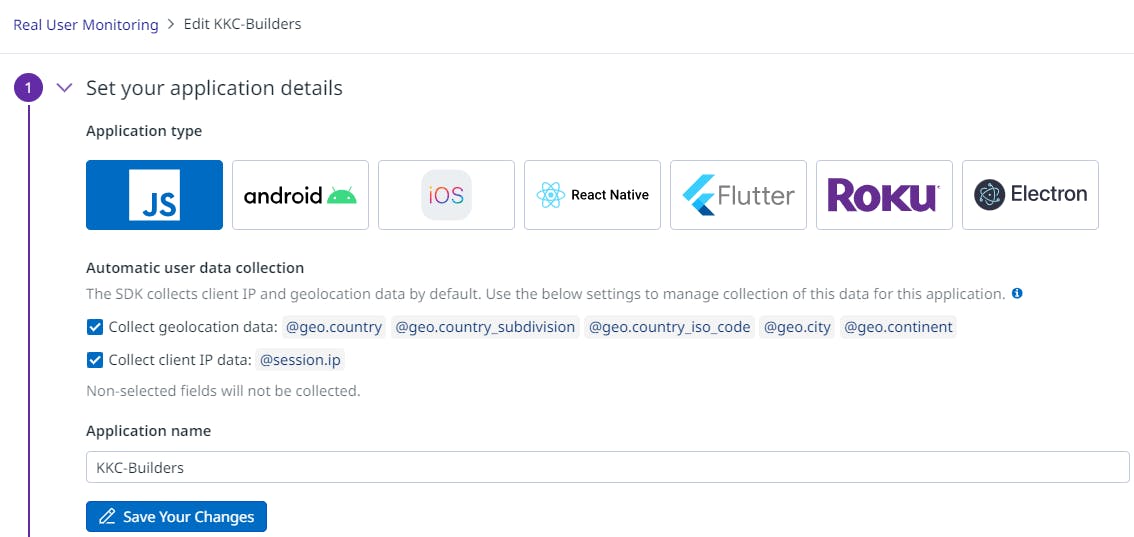
In the Datadog dashboard, navigate to the "Applications" tab.
Click on "New Application" to create a new application.
Give the application a name.
Select "Real User Monitoring" as the type of monitoring I want to set up.
Click "Save" to create the application.
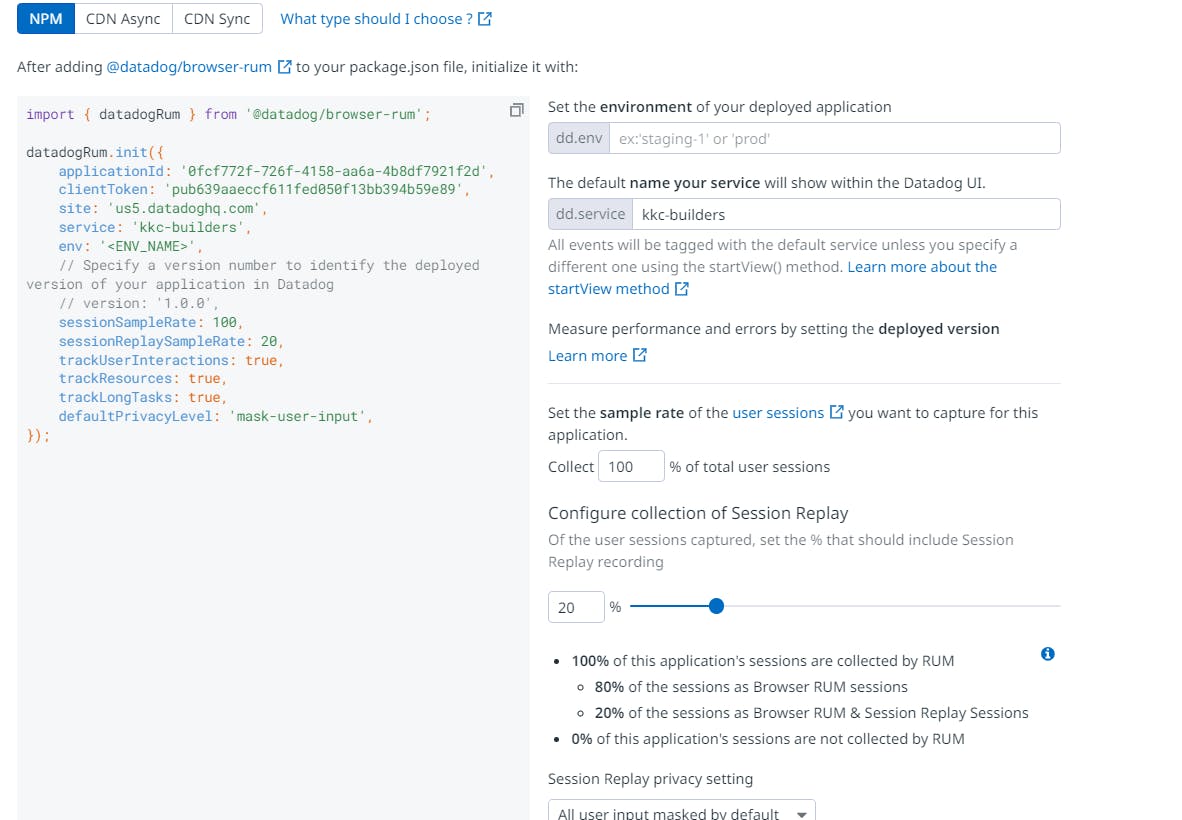
I need to then obtain the Datadog RUM JavaScript snippet
After creating the application, Datadog will provide me with a JavaScript snippet that I need to add to my website's HTML code. This snippet will collect data from my users' browsers and send it to Datadog for analysis. (There will be three different types of snippet :-NPM, CDN Async, CDN Sync. I chose CDN Async )
Copy the JavaScript snippet provided by Datadog.
Then I opened the Github repository of the website which I want to monitor and then :
Opened the index.html file.
Pasted the Datadog RUM JavaScript snippet just before the closing
</head>tag in that HTML file.Committed the changes.
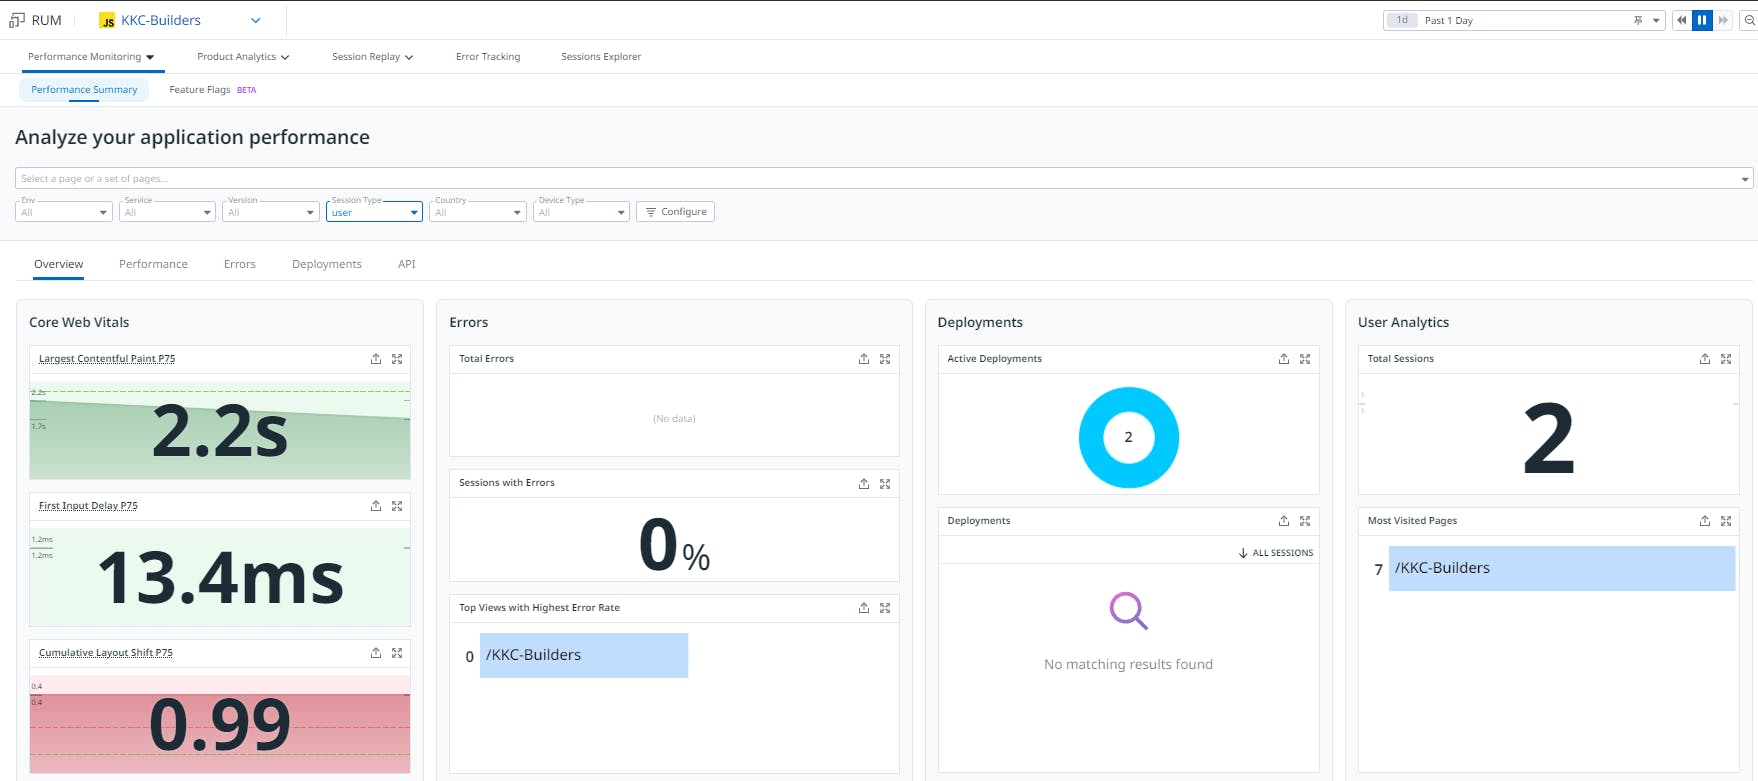
Now, Datadog will start collecting performance data from the users' browsers. I can now view this data and gain insights into how my website is performing.
So these are the insights which I got after some users visited my website:-
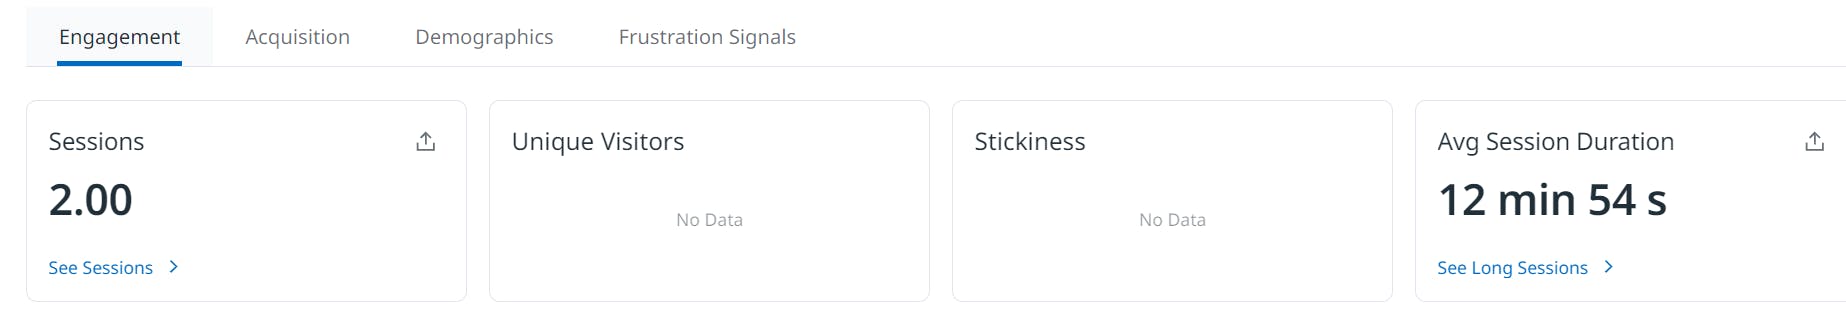
I can even see the Session Replays of my users . For example :-
https://drive.google.com/file/d/1cN-9sWql4vHfT-wVjtQdM_7fyZBAziZ_/view?usp=sharing
The above video clearly shows me the user experience of my user.
#Monitoring Apache using datadog :-
I already have an EC2 instance (Ubuntu) with Apache installed in it . I want to monitor it using datadog. STEPS :-
SSH into the Ubuntu server where Apache is installed.
Run the following commands to install the Datadog Agent.
      sudo DD_API_KEY=<your-api-key> DD_SITE="us5.datadoghq.com" DD_APM_INSTRUMENTATION_ENABLED=host  bash -c "$(curl -L https://s3.amazonaws.com/dd-agent/scripts/install_script_agent7.sh)"
      sudo service datadog-agent start
Next , we need to Installmod_statuson our Apache server and enableExtendedStatus.STEPS :-
sudo vi /etc/apache2/mods-enabled/status.conf
We have to set the Require ip directive to reflect the IP address of the machine that we will be accessing the server from.
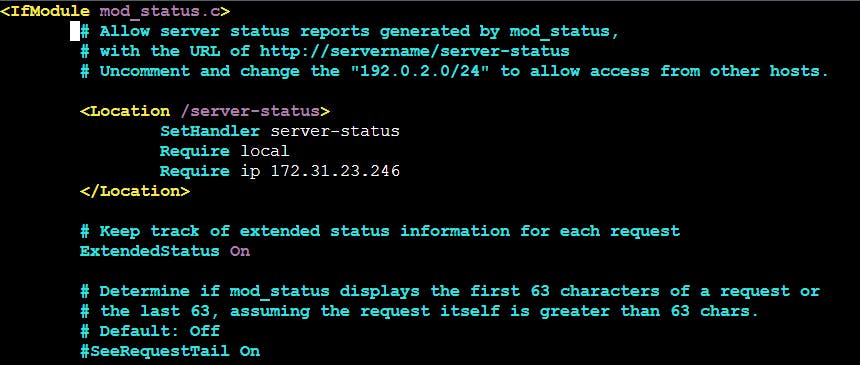
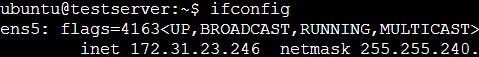
NOTE :- We can get the Require ip from :-
sudo apt install net-tools
ifconfig
Save the changes in status.conf file and use the below commands:-
sudo systemctl restart apache2
sudo systemctl status apache2
curl http://actual-server-ip/server-status
curl http://actual-server-ip/server-status?refresh=5
Then follow the below steps:-
sudo vim /etc/datadog-agent/conf.d/apache.d/conf.yaml.example
The conf.yaml.example shall contain the following :
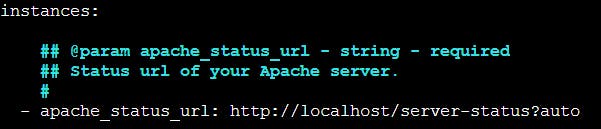
Then Copy the content of this file and paste it to a new file named as conf.yaml. Then save it.
Restart the Agent to load the new apache configuration file with the command : sudo service datadog-agent restart
We need to then install the Apache integration:
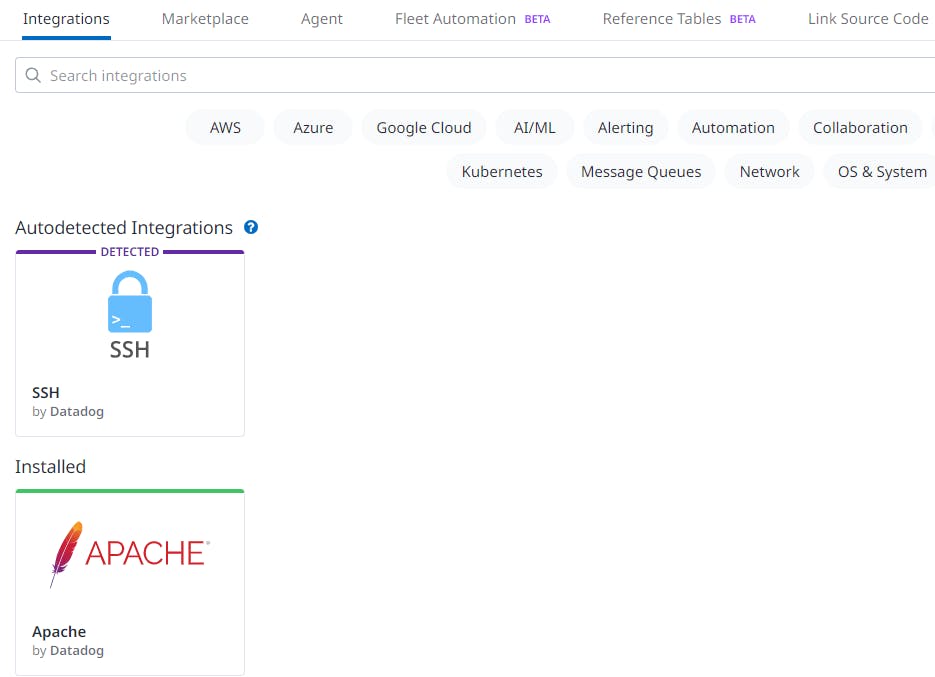
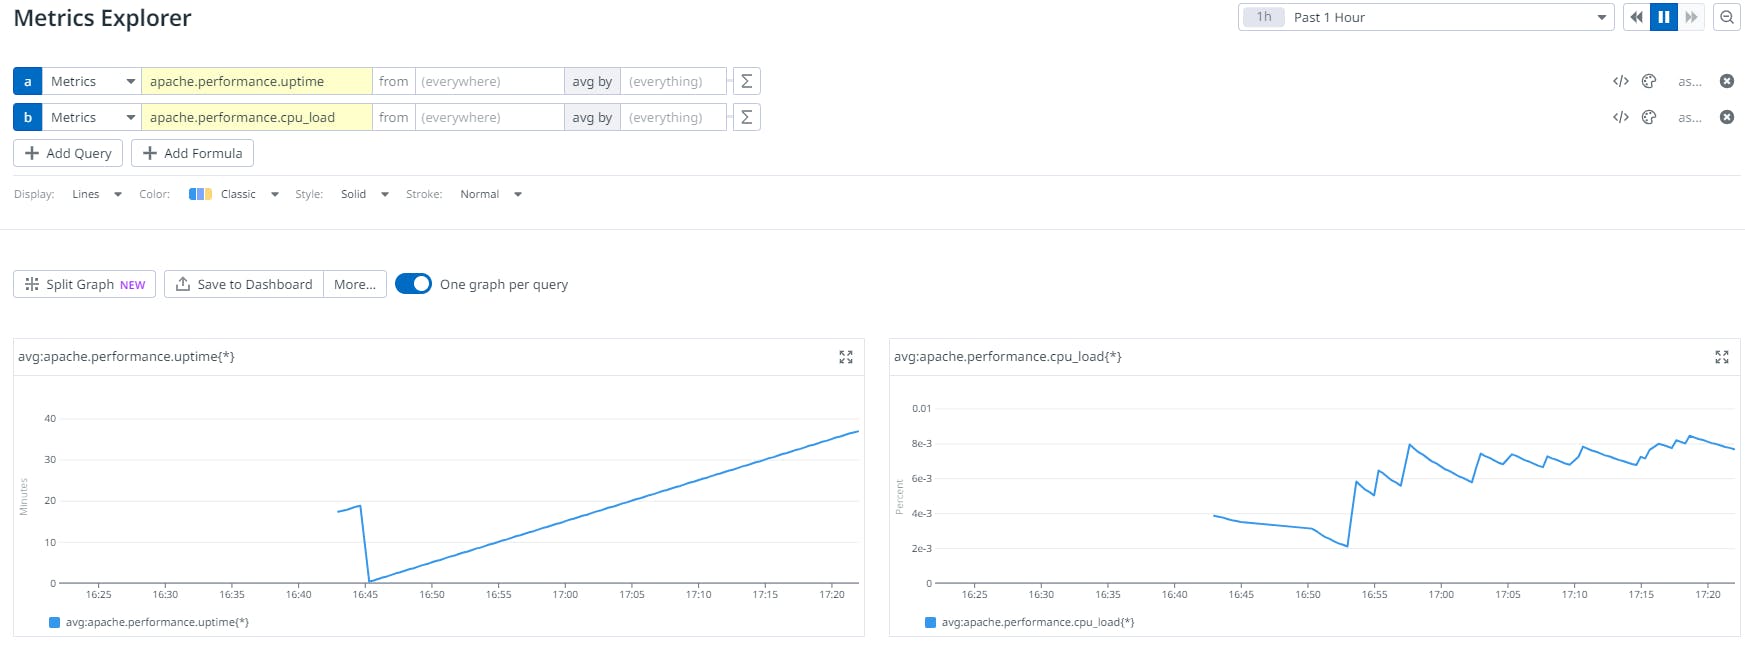
Now if we go to Metrics --> Explorer , we see :

We can now see different metrics like apache.performance.uptime , apache.performance.cpu_load ,etc as follows :
#Enable the Agent to collect logs :
cd /etc/datadog-agent
sudo vim datadog.yaml
We need to uncomment the line that starts with logs_enabled and set it to true :

Then use the command :
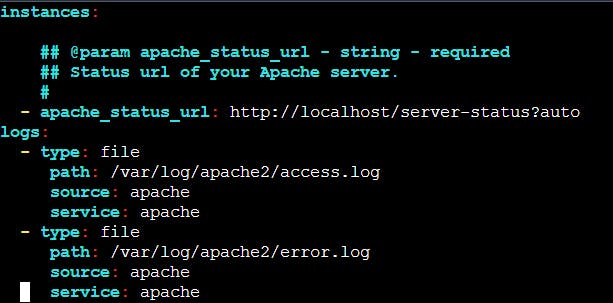
sudo vim /etc/datadog-agent/conf.d/apache.d/conf.yaml
And do the following changes in it and then save it :
Now restart the Agent by using the command :
sudo service datadog-agent restart
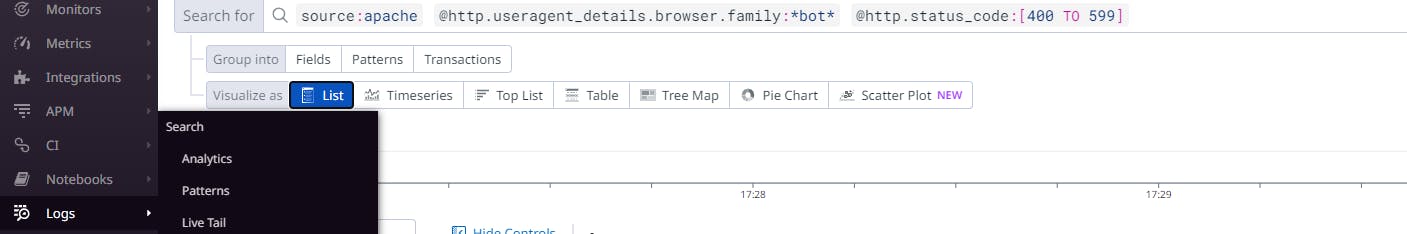
Now we can see the logs :
#Monitoring Jenkins using datadog :-
I already have an EC2 instance (Ubuntu) with Jenkins installed in it . I want to monitor it using datadog. STEPS :-
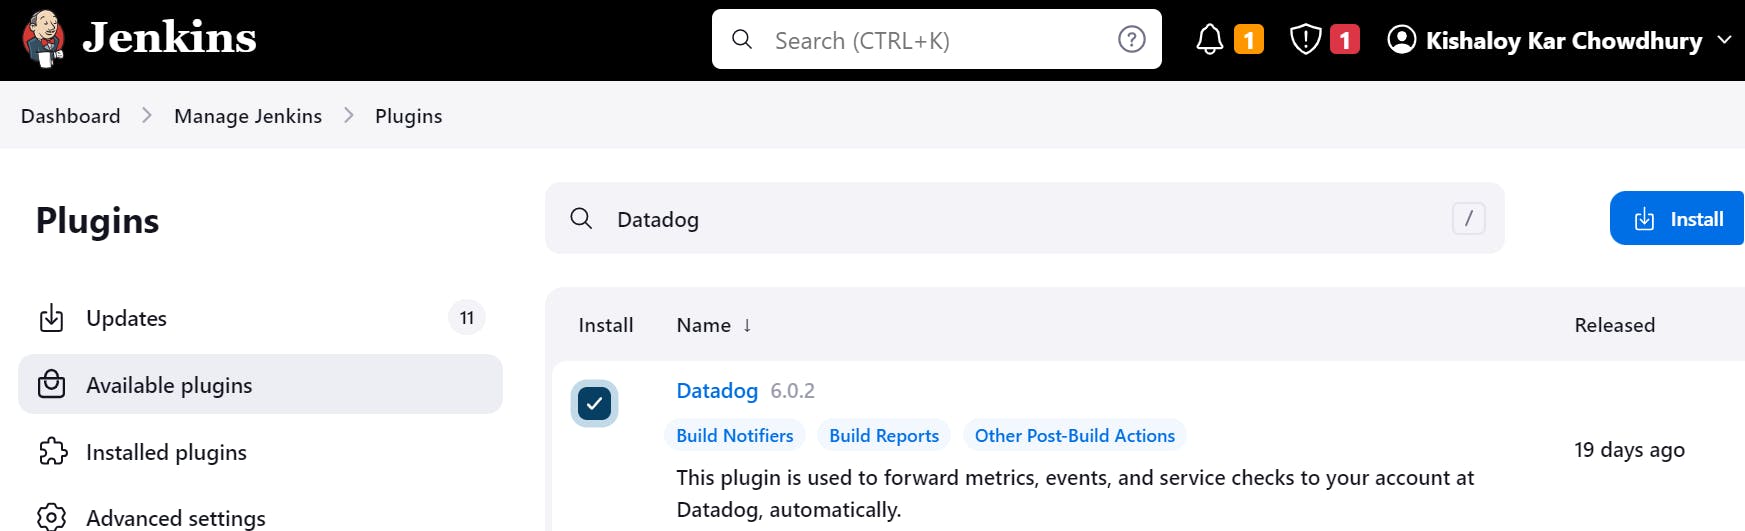
- After Signing in to my Jenkins account , I go to :
Manage Jenkins -->Plugin-->Datadog .*(Install Datadog Plugin)*
- SSH into the Ubuntu server where Jenkins is installed.
Run the following commands to install the Datadog Agent :
sudo DD_API_KEY=<your-api-key> DD_SITE="us5.datadoghq.com" DD_APM_INSTRUMENTATION_ENABLED=host  bash -c "$(curl -L https://s3.amazonaws.com/dd-agent/scripts/install_script_agent7.sh)"
sudo service datadog-agent start
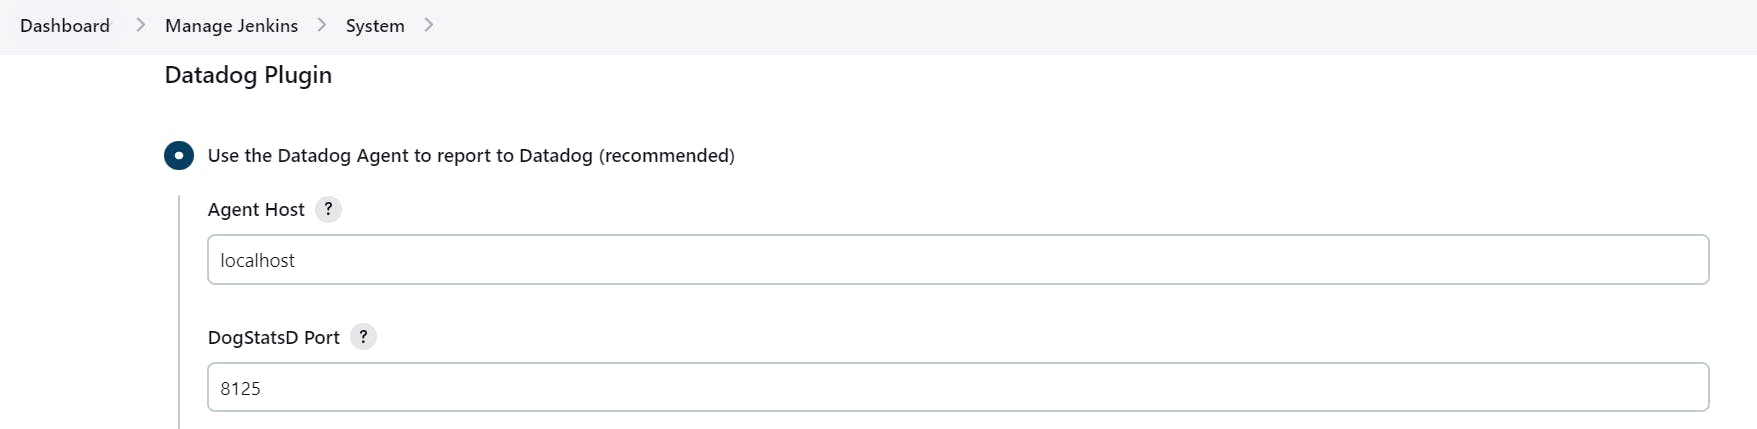
3)Then in Jenkins , go to Manage Jenkins --> System
(Fill the below details and SAVE)
We need to then install the Jenkins integration ( and then wait for some minutes):
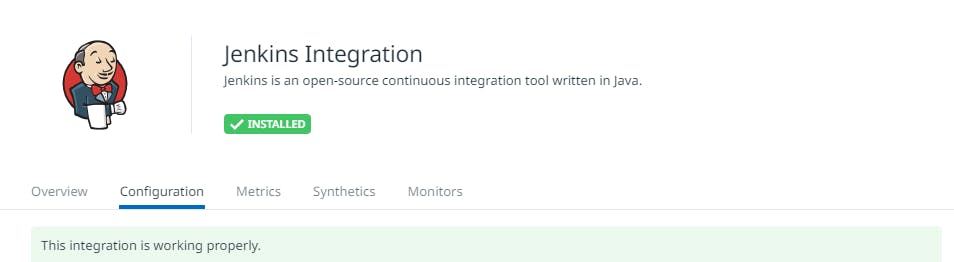
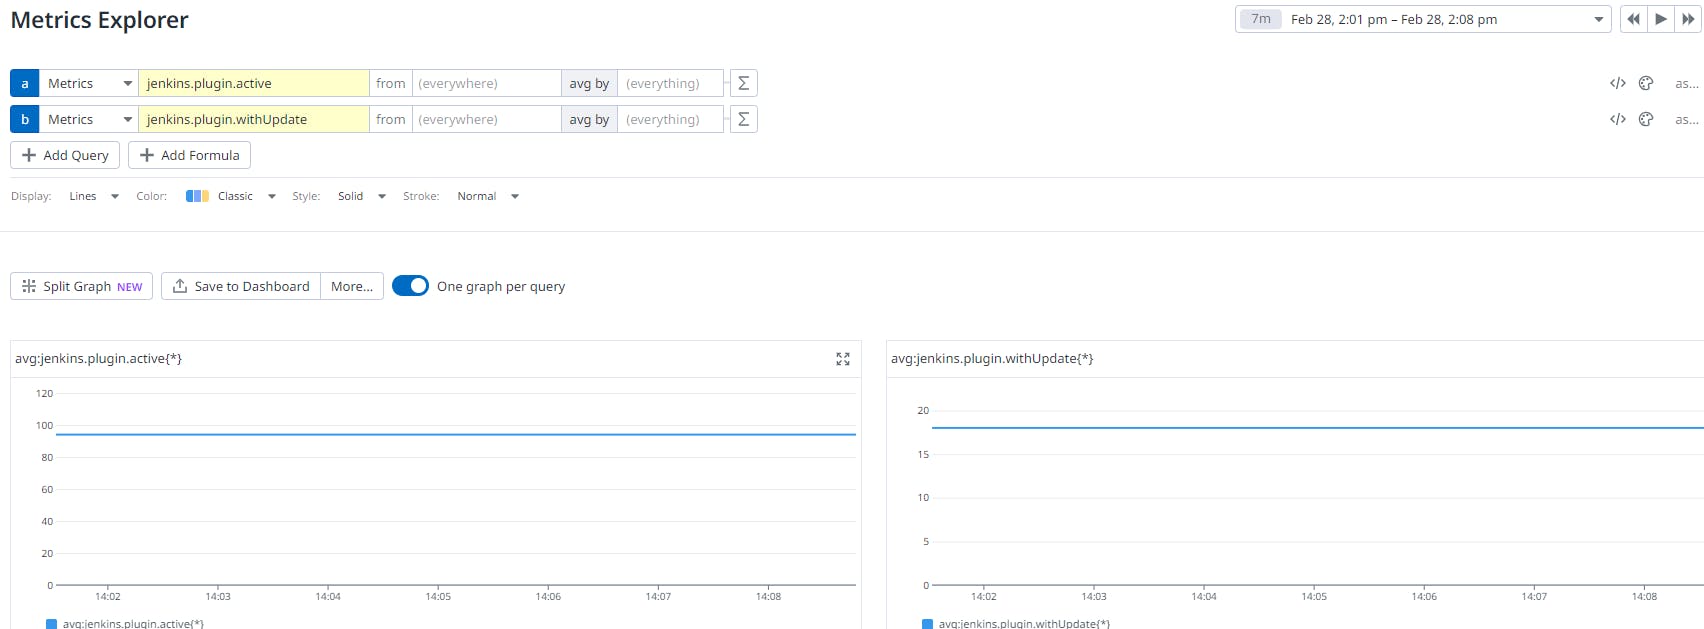
Finally , we are now able to monitor Jenkins:
ALERT AND MONITORING:
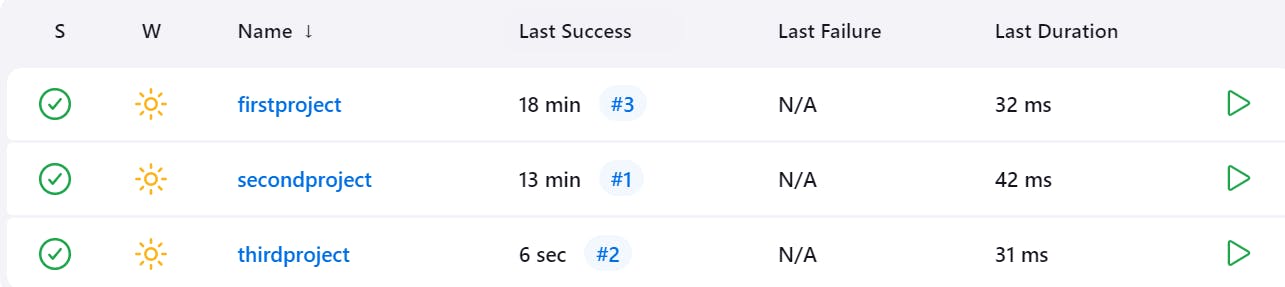
Suppose currently only two project are there in Jenkins:
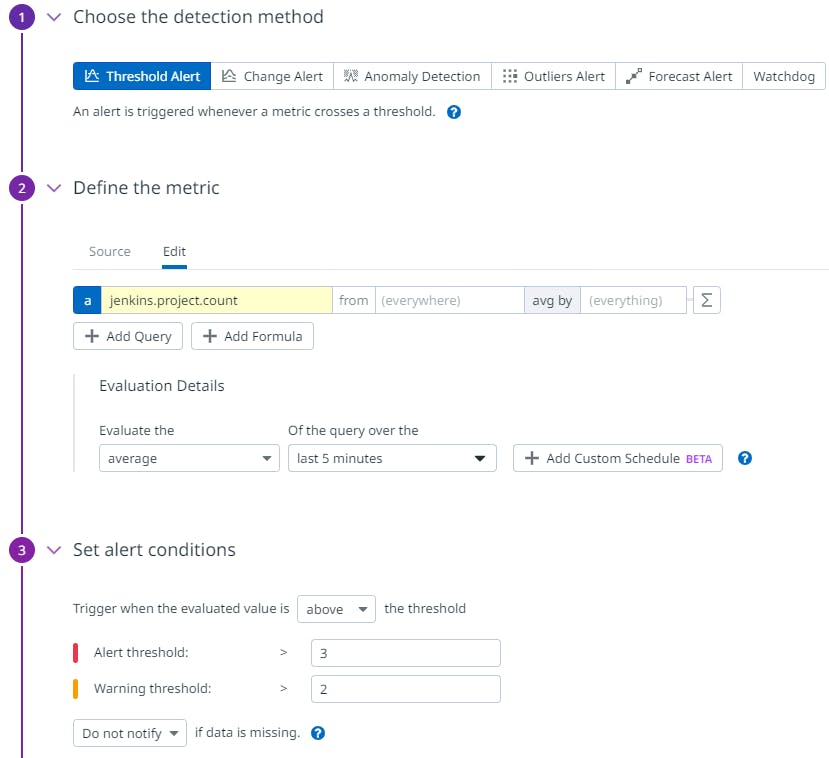
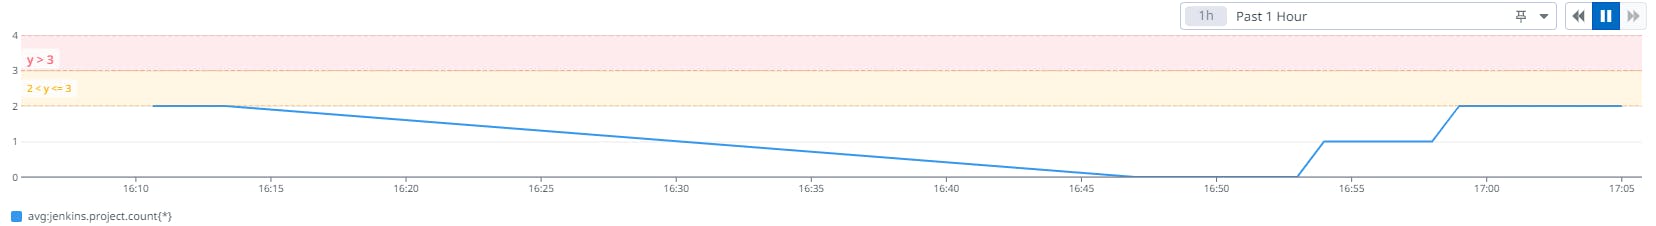
Now, I want a warning if there are three (or more) projects, and an alert if there are four(or more) project , then :-
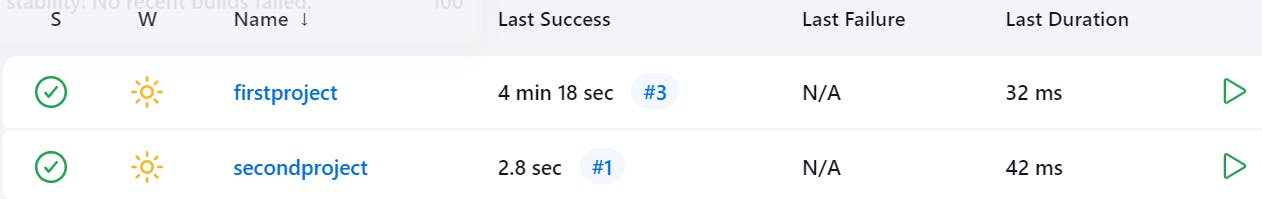
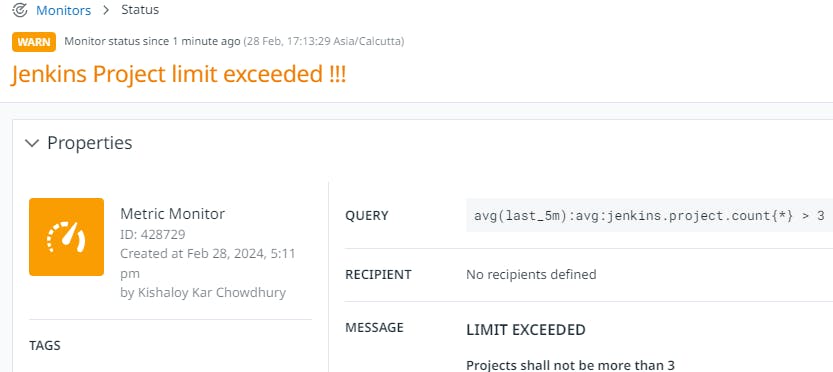
Now if I create one more project in Jenkins like this:
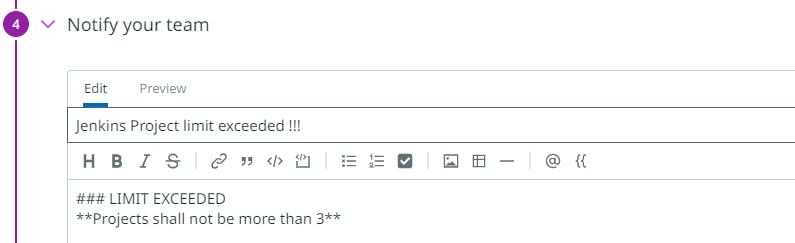
Then I receive a warning :
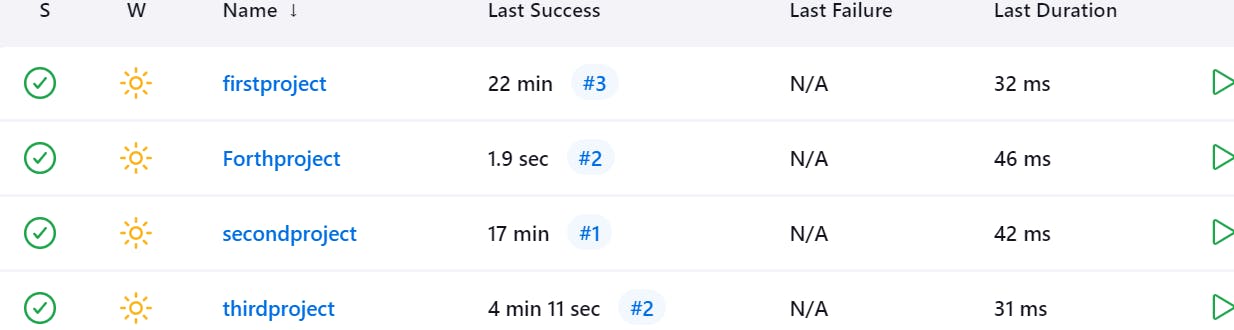
AND, if I create one more project in Jenkins like this:
Then I receive an Alert:
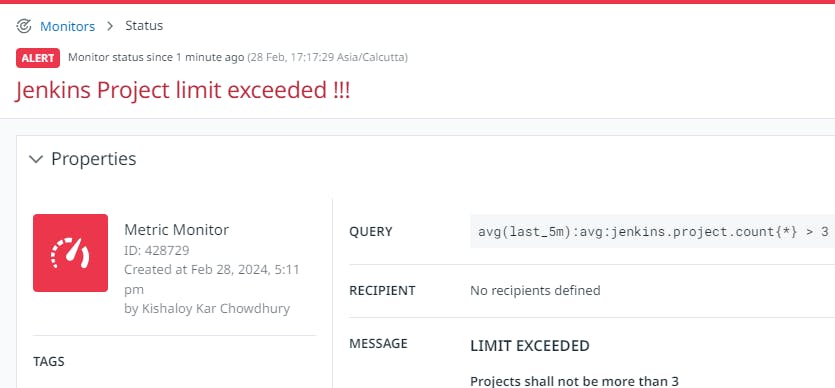
So this is an example of Alert and Monitoring
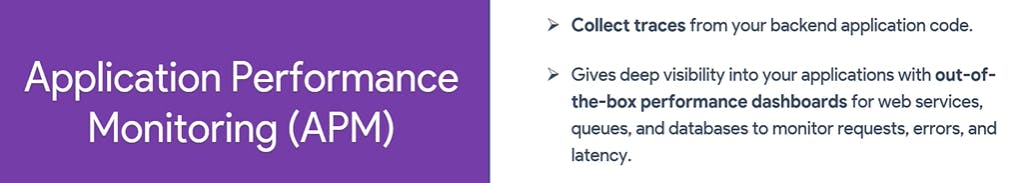
#WHAT IS APM ?
#AWS RDS PostgreSQL Monitoring with Datadog APM:-
1)Create an RDS PostgreSQL Database on the AWS Free Tier. Connect to Sqlectron. Follow the below link :-
https://youtu.be/I_fTQTsz2nQ?si=vl_TfyyWiF9PHpV-
- Follow the below video link to monitor AWS RDS PostgreSQL with Datadog APM :-
https://youtu.be/DQO1EkP26xY?si=gUMWuc1NZ2A3V6FX
#JAVA application (on Tomcat server) monitoring with Datadog APM:-
Just follow the below video link :-
https://youtu.be/mYmA00o1Jlg?si=9JFdcUQJl9BPyg-a
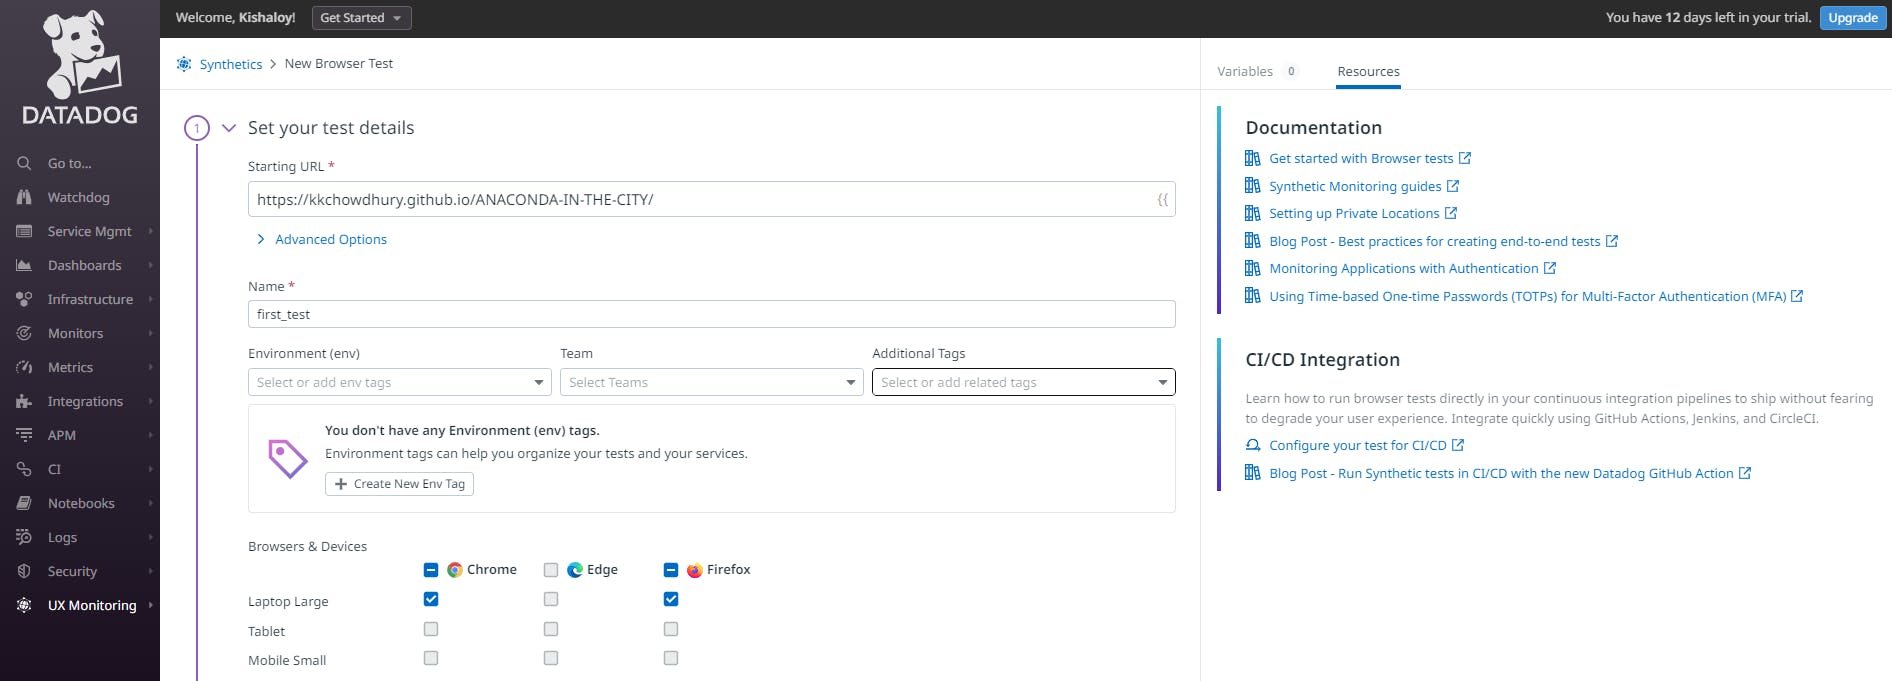
#Datadog Synthetic monitoring Browser Test:-
1)In Datadog , go to UX Monitoring-->Synthetic Tests-->Create a New Browser Test.
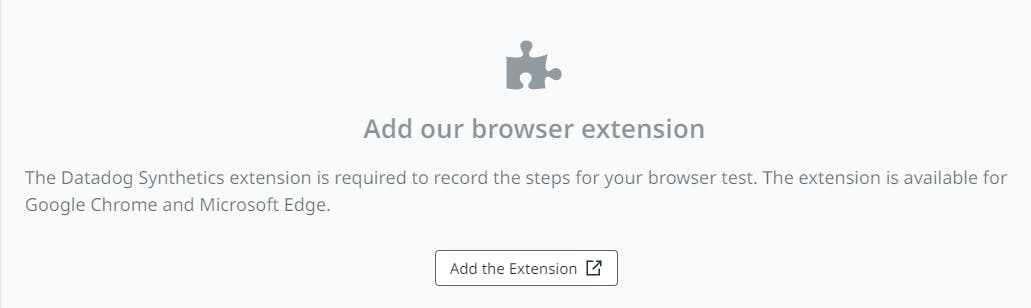
2)We need to add a Browser Extension.
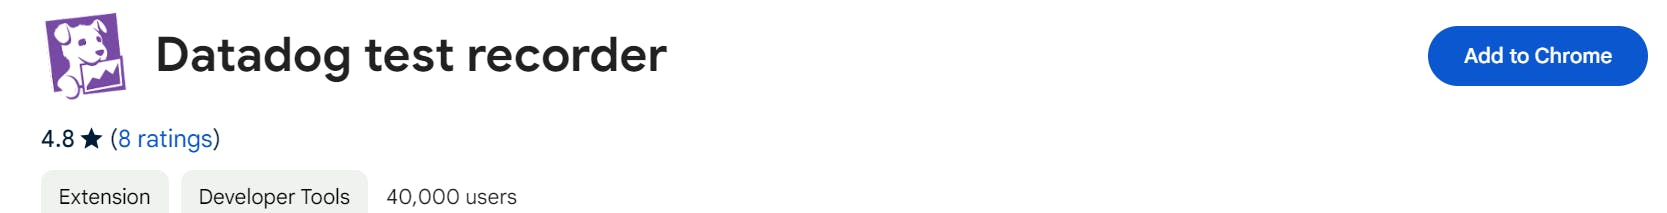
THEN WE SEE :-
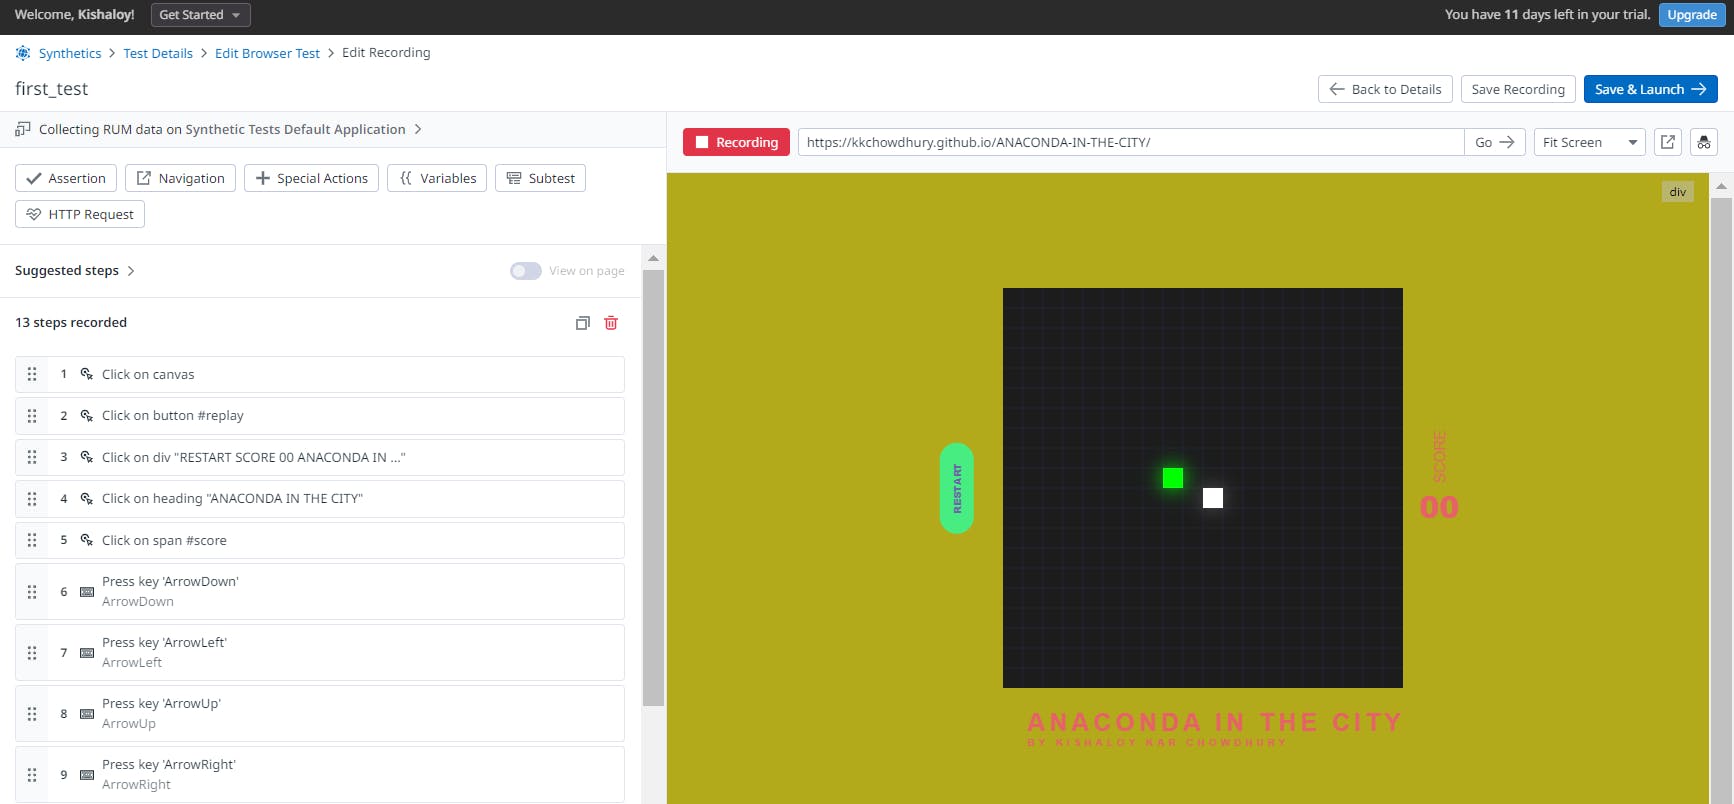
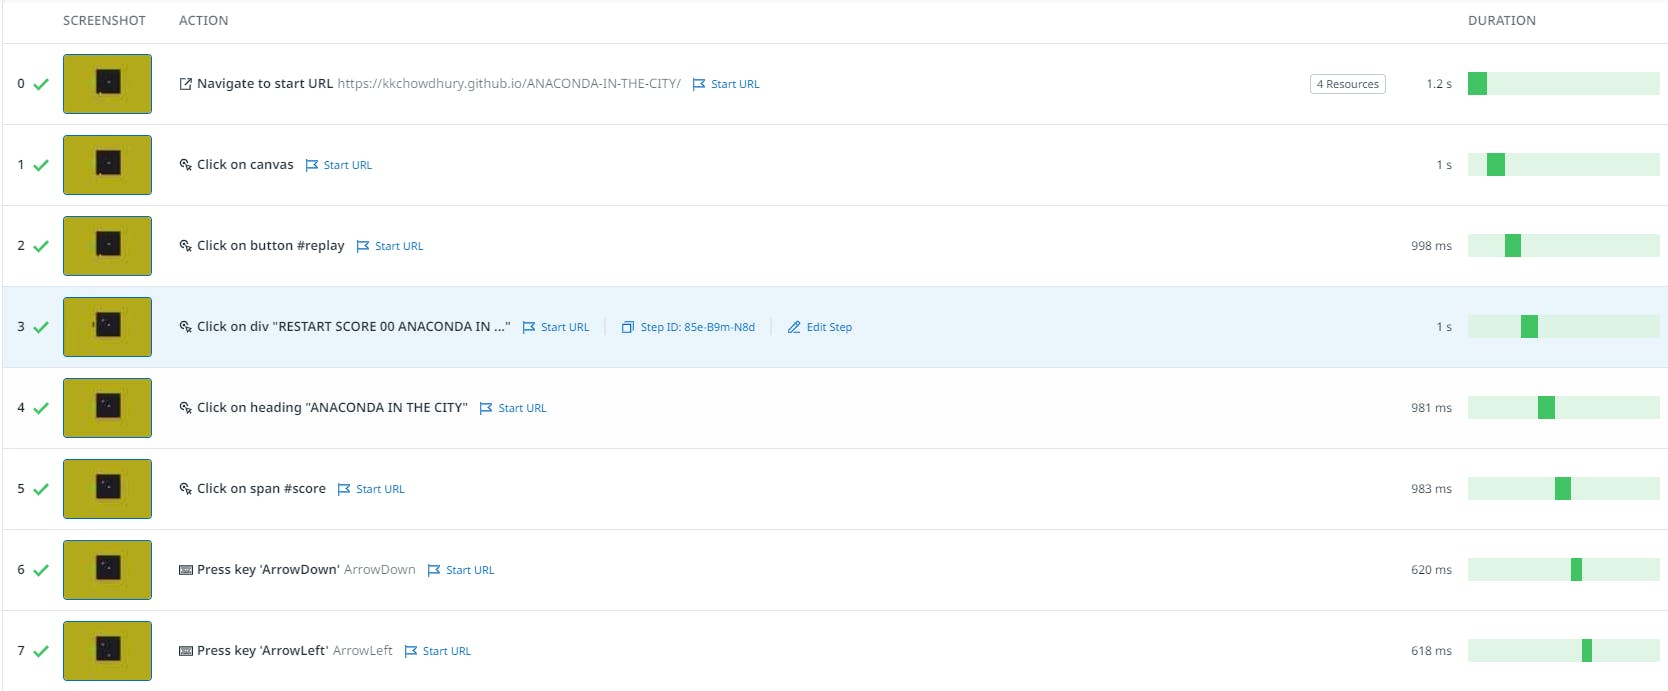
So, this is how synthetic testing of Browser is being done.
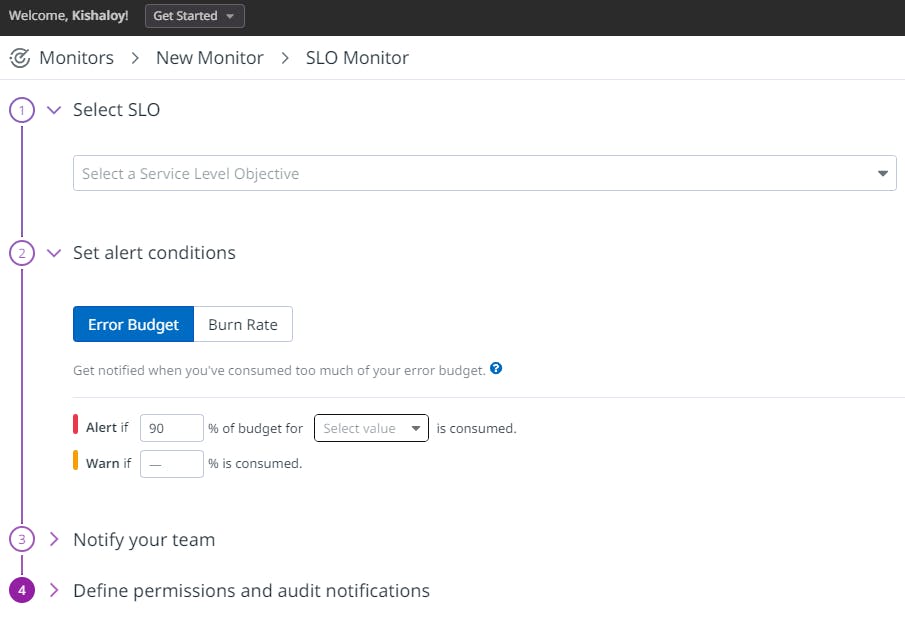
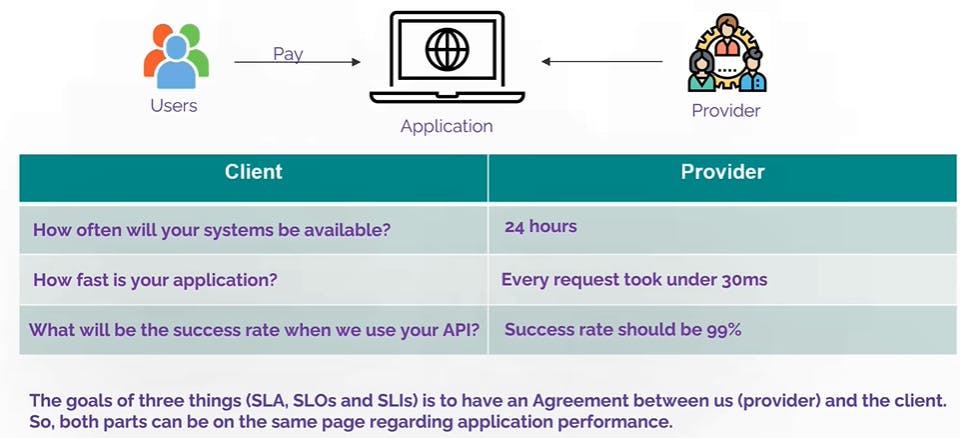
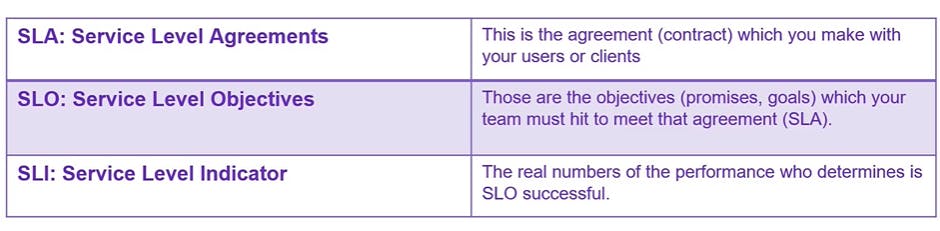
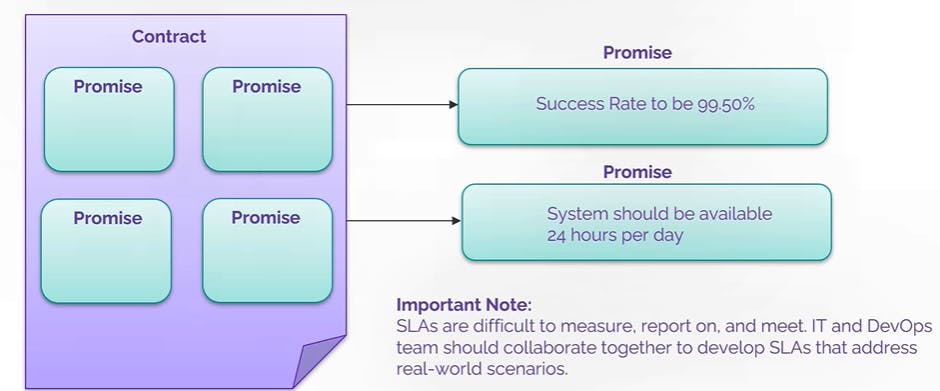
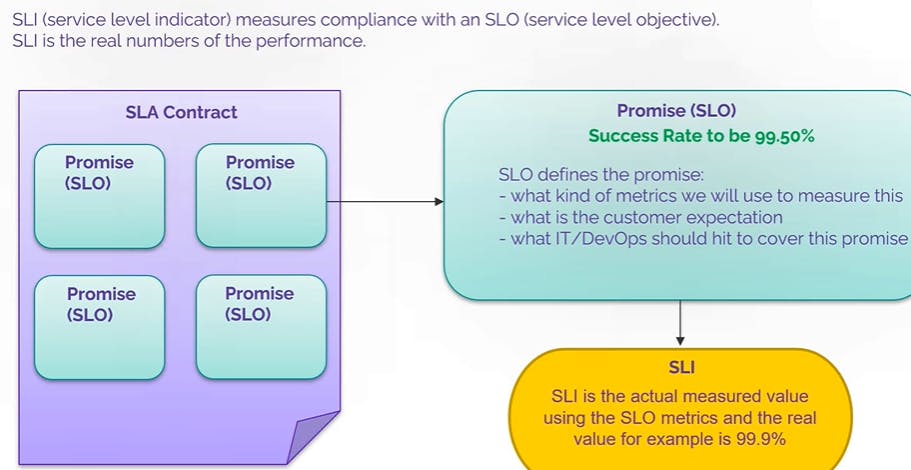
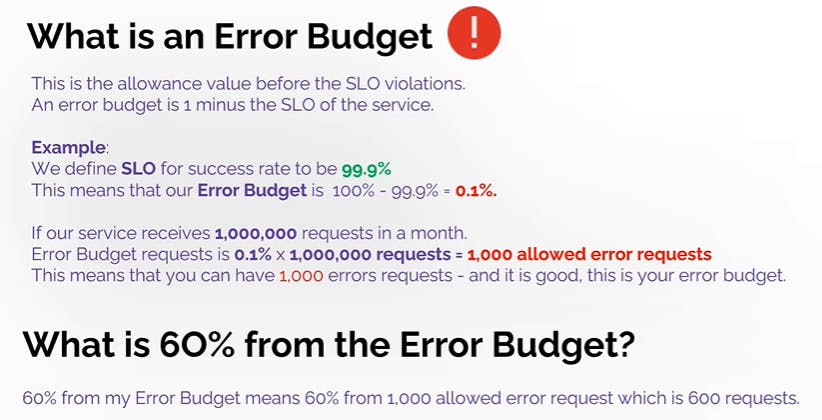
#Monitoring SLO,SLI,SLA and Error Budget:

This is how an SLO monitor is being created :